Benchmarks
BenchmarkDotNet
Bombardier Load Tests
hardware: AMD Ryzen 9 5950X (16c/32t), 32GB RAM
software: .NET 9.0 RC2, Windows 11
parameters: -c 512 -m POST -f "body.json" -H "Content-Type:application/json" -d 30s
Minimal APIs
Statistics        Avg      Stdev        Max
  Reqs/sec    257730.00   18733.46  360540.81
  Latency        1.97ms     0.91ms   390.00ms
  HTTP codes:
    1xx - 0, 2xx - 7787939, 3xx - 0, 4xx - 0, 5xx - 0
    others - 0
  Throughput:   130.23MB/s
FastEndpoints
Statistics        Avg      Stdev        Max
  Reqs/sec    254103.07   17146.14  289439.60
  Latency        1.99ms     0.95ms   415.00ms
  HTTP codes:
    1xx - 0, 2xx - 7679513, 3xx - 0, 4xx - 0, 5xx - 0
    others - 0
  Throughput:   128.41MB/s
MVC Controller
Statistics        Avg      Stdev        Max
  Reqs/sec    224798.56   17129.93  258658.48
  Latency        2.25ms     1.01ms   388.00ms
  HTTP codes:
    1xx - 0, 2xx - 6800642, 3xx - 0, 4xx - 0, 5xx - 0
    others - 0
  Throughput:   113.71MB/s
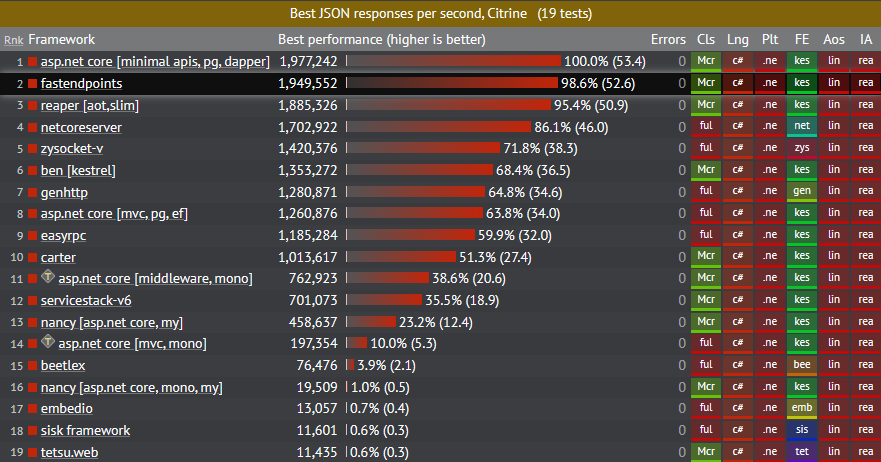
TechEmpower Benchmark (Preliminary)
